Scores vs. Spending
More spending. Are Highline students getting better results?
Highline spends thousands more per student than the state average, yet too many students are not meeting grade-level standards.
These charts compare Highline's per-student spending with academic proficiency in ELA, Math, and Science. They show that more money has not translated into better outcomes for students.
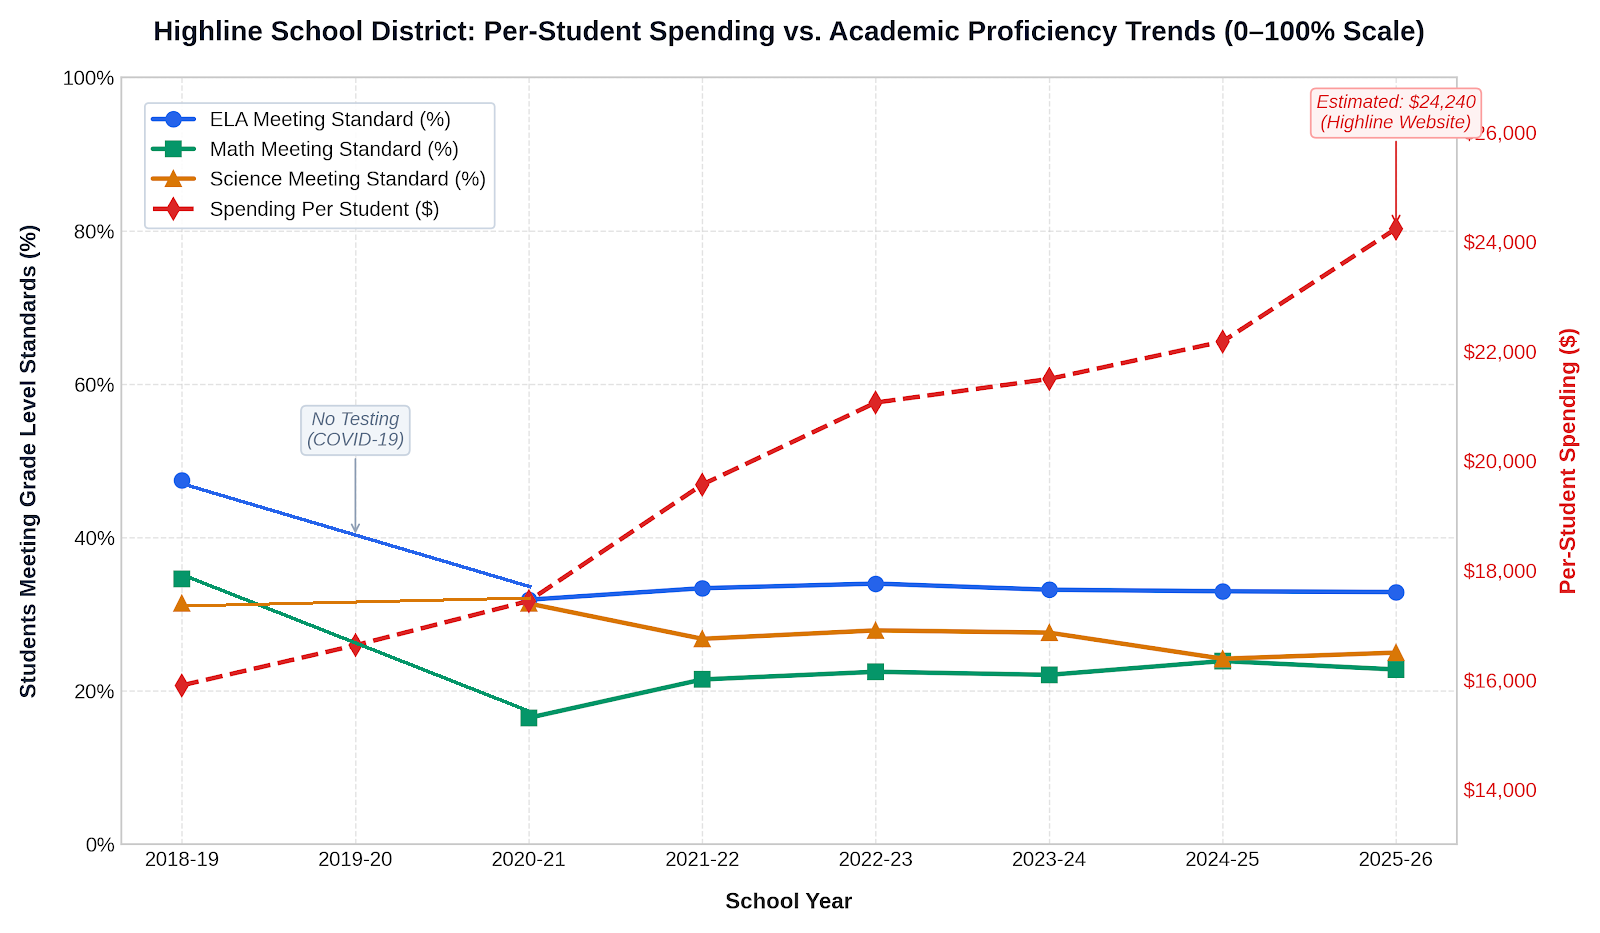
Since 2018, per-student funding in the Highline School District has increased substantially, reaching an estimated $24,240 for the 2025-26 school year, yet academic proficiency rates across ELA, Math, and Science remain significantly below grade-level standards. This trend indicates that rising expenditures are not effectively translating into improved student outcomes, based on data from the Office of Superintendent of Public Instruction (OSPI) and Highline Public Schools.
Highline Spending and Student Results
2024-25 comparison with nearby school districts and the Washington state average
Spending Per Student
ELA Proficiency
Math Proficiency
Science Proficiency
Note: OSPI has not yet published 2025-26 per-student expenditure data, so this comparison uses the most recent comparable year: 2024-25.
Nearby districts differ in student needs, enrollment and revenue sources; spending alone does not measure district wealth.
Source: OSPI Washington State Report Card